


A 5-step framework for year-end PPC reports that resonate with leadership


The new year is here, which means it’s time to deliver your end-of-year (EOY) PPC report.
But an EOY report isn’t just a longer version of your monthly performance check-in.
It’s typically read by a different audience – often leadership teams who don’t see your regular reporting – and it needs to tell a different story.
Done well, your year-end report sets the tone for 2026, earns buy-in for your strategy, and positions you as a strategic partner rather than just a campaign manager.
Done poorly, it creates confusion and undermines confidence in your work.
Here’s how to build an EOY PPC report that speaks to leadership and sets your work up for success in the year ahead.
1. Identify your audience and their priorities
You wouldn’t launch a new campaign without clearly defined goals and audiences.
Don’t do it with your EOY report, either. Different stakeholders evaluate performance through very different lenses.
For example, among the clients I’m preparing reports for this year are:
- A leadership team I’ve never met (despite working with this client for eight years) that wants a maximum five-page report at a very high level.
- A data-driven CEO who wants a clear narrative connecting PPC spend, decisions, and outcomes.
- A new director who wants context on the competitive landscape, performance, and specific opportunities for next year.
If I were to use a carbon-copy EOY report template for all of them, I’d have at best one happy leadership team and two confused or frustrated teams.
I don’t care for those odds. Instead, I’m customizing each report to match the readers and their specific needs.

If you don’t know the recipients (and if you’re at an agency, there’s a good chance you don’t), ask your primary contact questions like:
- Who will be receiving the report?
- What do they care about most?
- What’s top of mind for them heading into next year?
- What decisions will they be making based on this report?
The answers should directly inform the report’s structure, depth, metrics, and length.
When your audience is clearly defined upfront, the final report is far more likely to drive clarity, alignment, and confidence.
2. Create an easy-to-read executive summary
Your executive summary has one job – help leadership quickly understand how PPC performed across key metrics.
Think of it as the “at a glance” page that sets the context for everything that follows.
If you studied communications formally, you probably learned to write executive summaries last, even though they appear first.
Since you’re pulling data rather than crafting prose, flip that approach.
Build this section first to guide the flow of what comes next.
Lead with the KPIs that matter most
Start with the metrics your audience actually cares about – the ones that were established as priorities at the beginning of the engagement or year.
This will usually include revenue, leads, and conversions, but your mileage may vary.
If your leadership team obsesses over market share or engagement, lead with those instead.
Include meaningful benchmarks
Unless your leadership team is dialed into PPC goals and performance, you need to give them benchmarks so they have a comparison tool.
Use at least one of these three key benchmarks:
- Year-over-year performance: How did this year stack up against last year?
- Performance against target: Did we hit the goals we set out to achieve?
- Industry benchmarks: How do we compare to competitors or industry averages?
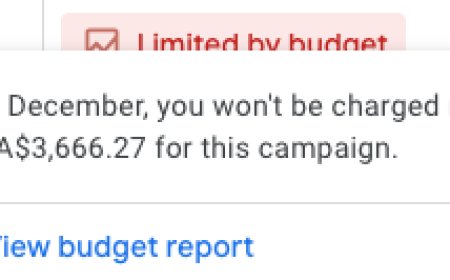
In the example below, I’m showing revenue, ROAS, and cost for the year, with both percentage changes and raw numbers from the previous year.

This format does the heavy lifting for busy executives.
At a quick glance, they know what happened and whether it’s good news.
More importantly, it sets the stage for invisible CTAs and the deeper analysis that follows.
3. Break down performance details
In the following section, you’ll move from “what happened” to “why it happened and what we learned.”
The executive summary told your reader whether the year was successful. Now you need to show them the engine under the hood.
The level of detail will depend on the format. A five-page executive report may only have room for a few pivotal moments, while a more comprehensive report can get into the weeds.
In either case, selectivity is critical. You can’t — and shouldn’t — document every metric, test, or optimization from the year.
Instead, focus on insights that either explain the results in your executive summary or point directly to opportunities for the year ahead.
Here are some categories to get you started.
What performed best
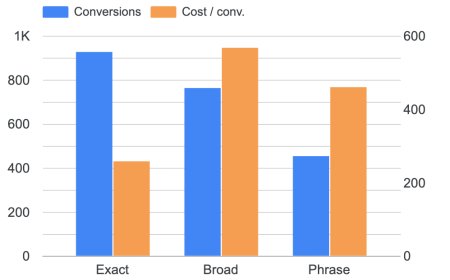
Show them the winners: your best-converting creative, highest-revenue products, or most efficient channels.
Leadership loves to see what’s working, and it can point to where to double down.
How resources were allocated
Break down spend distribution across campaign types, the split between brand and non-brand, or platform-specific investments like Google versus Bing.
Leadership wants to know if you’re putting money where it matters most, and this section answers that question.

What you tested and learned
Highlight new initiatives, strategic experiments, or incrementality tests.
Did you test a new platform? Try a different targeting approach?
These insights show you aren’t just managing campaigns, you’re advancing the strategy.
Trends that shaped the year
Include year-over-year comparisons, seasonal patterns, and performance trends over time.
If Q3 saw unusual momentum or holiday performance differed from previous years, explain why.
Performance through the funnel
Show how users moved through your conversion funnel and where the biggest opportunities or bottlenecks exist.
Tracking and conversion changes
Changing what is counted as a conversion will affect just about everything else.
If you made tracking or conversion definition changes during the year, call them out here.
Leadership needs to understand if a metric shift reflects actual performance or a measurement change.

Keep this section platform-specific and substantive. Each insight should clearly tie back to the executive summary.
Use visuals (charts, trend lines, and comparison tables) to make complex data easier to interpret. And resist the temptation to include everything you track.
If a metric doesn’t explain results, answer a question from leadership, or inform future strategy, leave it out.
4. Evaluate external factors
You’ve already explained what happened in the account and why performance moved the way it did.
Now you need to zoom out and show leadership what else was happening. What external forces shaped your results, for better or worse?
This is where you separate execution from environment.
Without this context, strong strategic work can look mediocre in a difficult year, or weak decisions can hide behind tailwinds.
Leadership needs to understand what you controlled versus what you were responding to.
Think of it this way: performance details add context to your KPIs. External factors add context to your performance.
Digital marketing factors
What influenced performance that was external to paid search execution, but internal to the broader marketing ecosystem?
- Non-PPC marketing initiatives: Product launches, pricing changes, promotions, website redesigns, or messaging shifts can all impact conversion rates and search behavior – positively or negatively.
- Non-PPC channel performance: Performance in organic search, email, social, affiliates, or offline channels can meaningfully influence paid search results. It also provides a clearer picture of market factors beyond paid channels.

- Platform and policy changes: Google Ads feature rollouts, automation shifts, policy enforcement, or reporting changes often affect performance in ways that aren’t immediately visible in metrics alone.
- Competitive dynamics: New entrants, aggressive bidding, creative shifts, or changes in competitor behavior can alter auction pressure and efficiency over time.
Macro-economic factors
What forces outside the marketing organization shaped demand, behavior, and constraints?
A useful way to structure this analysis is with a lightweight PESTEL lens, adapted for a marketing context.
- Political: Gov actions and policy shifts (e.g., tariffs, shutdowns).
- Economic: Market conditions (e.g., inflation, spending slowdowns).
- Social: Behavior and lifestyle trends (e.g., travel, demographics).
- Technological: Platform/tech changes (e.g., AI, privacy updates).
- Environmental: Weather and seasonality (e.g., storms, climate shifts).
- Legal: Regulations and compliance (e.g., privacy laws, labor rules).
You don’t need to address every category. The goal is to highlight the factors that materially influenced performance and decisions during the year.
In a volatile year like this one, it can even make sense to highlight big events that didn’t have an impact on performance, just to assuage any worries.

Doing this helps stakeholders understand what factors contributed to performance.
And just as important, it positions you as someone who sees beyond the interface to meaningful business implications.
5. Answer the ‘what’s next?’ question
Leadership wants to know what to expect for next year.
They’re not necessarily expecting a crystal ball, but they do want confidence that there’s a plan, even if the path changes.
The reality is that most paid search strategy isn’t mapped a year in advance.
Platforms change, competitors react, budgets shift, and new constraints appear with little warning.
What matters isn’t having every answer upfront, it’s having a clear way to decide what to do next when conditions change.
This section of your EOY report is your opportunity to show that decision-making framework, and get your audience excited to work with you on what’s to come.
Next steps and recommendations
These are the initiatives you’re committed to pursuing; the strategic moves grounded in last year’s data:
- Applied learnings: How insights from the past year are shaping priorities, structure, and decision-making going forward.
- Identified opportunities: Areas where data consistently pointed to upside: channels, audiences, products, or tactics that warrant attention.
- Known risks: Challenges leadership should expect, along with how you’re monitoring or mitigating them.
- Resource clarity: What additional budget, tools, or support would enable — and what remains constrained without them. Be concrete: “With X additional budget, we can test Y based on Z insight from last year.”
These recommendations should feel inevitable; the logical next steps given what happened last year.

Testing pipeline
Then there’s the other category: things you’re watching, interested in, or ready to jump on if circumstances align.
These scratch leadership’s itch for innovation and cutting-edge solutions without overcommitting:
- New platform features you’ll test when they’re released.
- Emerging platforms or initiatives worth monitoring.
- Competitive tactics you’ve identified but need more validation.
- Opportunistic tests if budget or priorities shift.
Frame these as “if/then” scenarios or “things we’re monitoring” rather than firm commitments.
Leadership gets to feel like you’re on top of industry trends without expecting guarantees.

A final pass through a leadership lens
You’ve covered a lot of ground.
This final pass is about tightening credibility and making sure this work pays dividends in the coming years, not just this one.
Give your report a final pass
Before sending, review the report the way leadership will:
- Source your data clearly: Label where each chart’s data came from and when it was pulled. This prevents follow-up questions and builds trust.
- Address negatives head-on: Leadership expects challenges. What erodes confidence isn’t bad news, it’s unexplained bad news. Show what didn’t work, why, and what you did about it.
- Pressure-test against the brief: Review your stakeholders’ original requests. Did you actually answer their questions? Ask a colleague (or AI) for a second set of eyes.
Make next year easier
Now that you’ve done the heavy lifting, leverage this work going forward:
- Turn your EOY report into a client-specific template: A single format won’t work across all clients, but once you find a structure that resonates with a given audience, reuse it year over year. Incorporate feedback and refresh the data, but keep the core framework consistent.
- Track big issues as they happen: Document key events as you progress through the year. Keep a running list, outside of emails and reports. Even the biggest issues today will be hard to accurately remember in 12 months without this.
Year-end reports take real effort. Make sure yours actually resonates.
Follow these steps to strengthen stakeholder relationships and position yourself as a strategic partner for 2026 and beyond.
What's Your Reaction?
 Like
0
Like
0
 Dislike
0
Dislike
0
 Love
0
Love
0
 Funny
0
Funny
0
 Angry
0
Angry
0
 Sad
0
Sad
0
 Wow
0
Wow
0